Services: Product Design, Engineering
Vodafone
Turning complexity into clarity at global scale.
- Client
- Vodafone
- Industry
- Telecommunications
- Focus
- Enterprise operations
- Service
- UX/UI & Development
About project
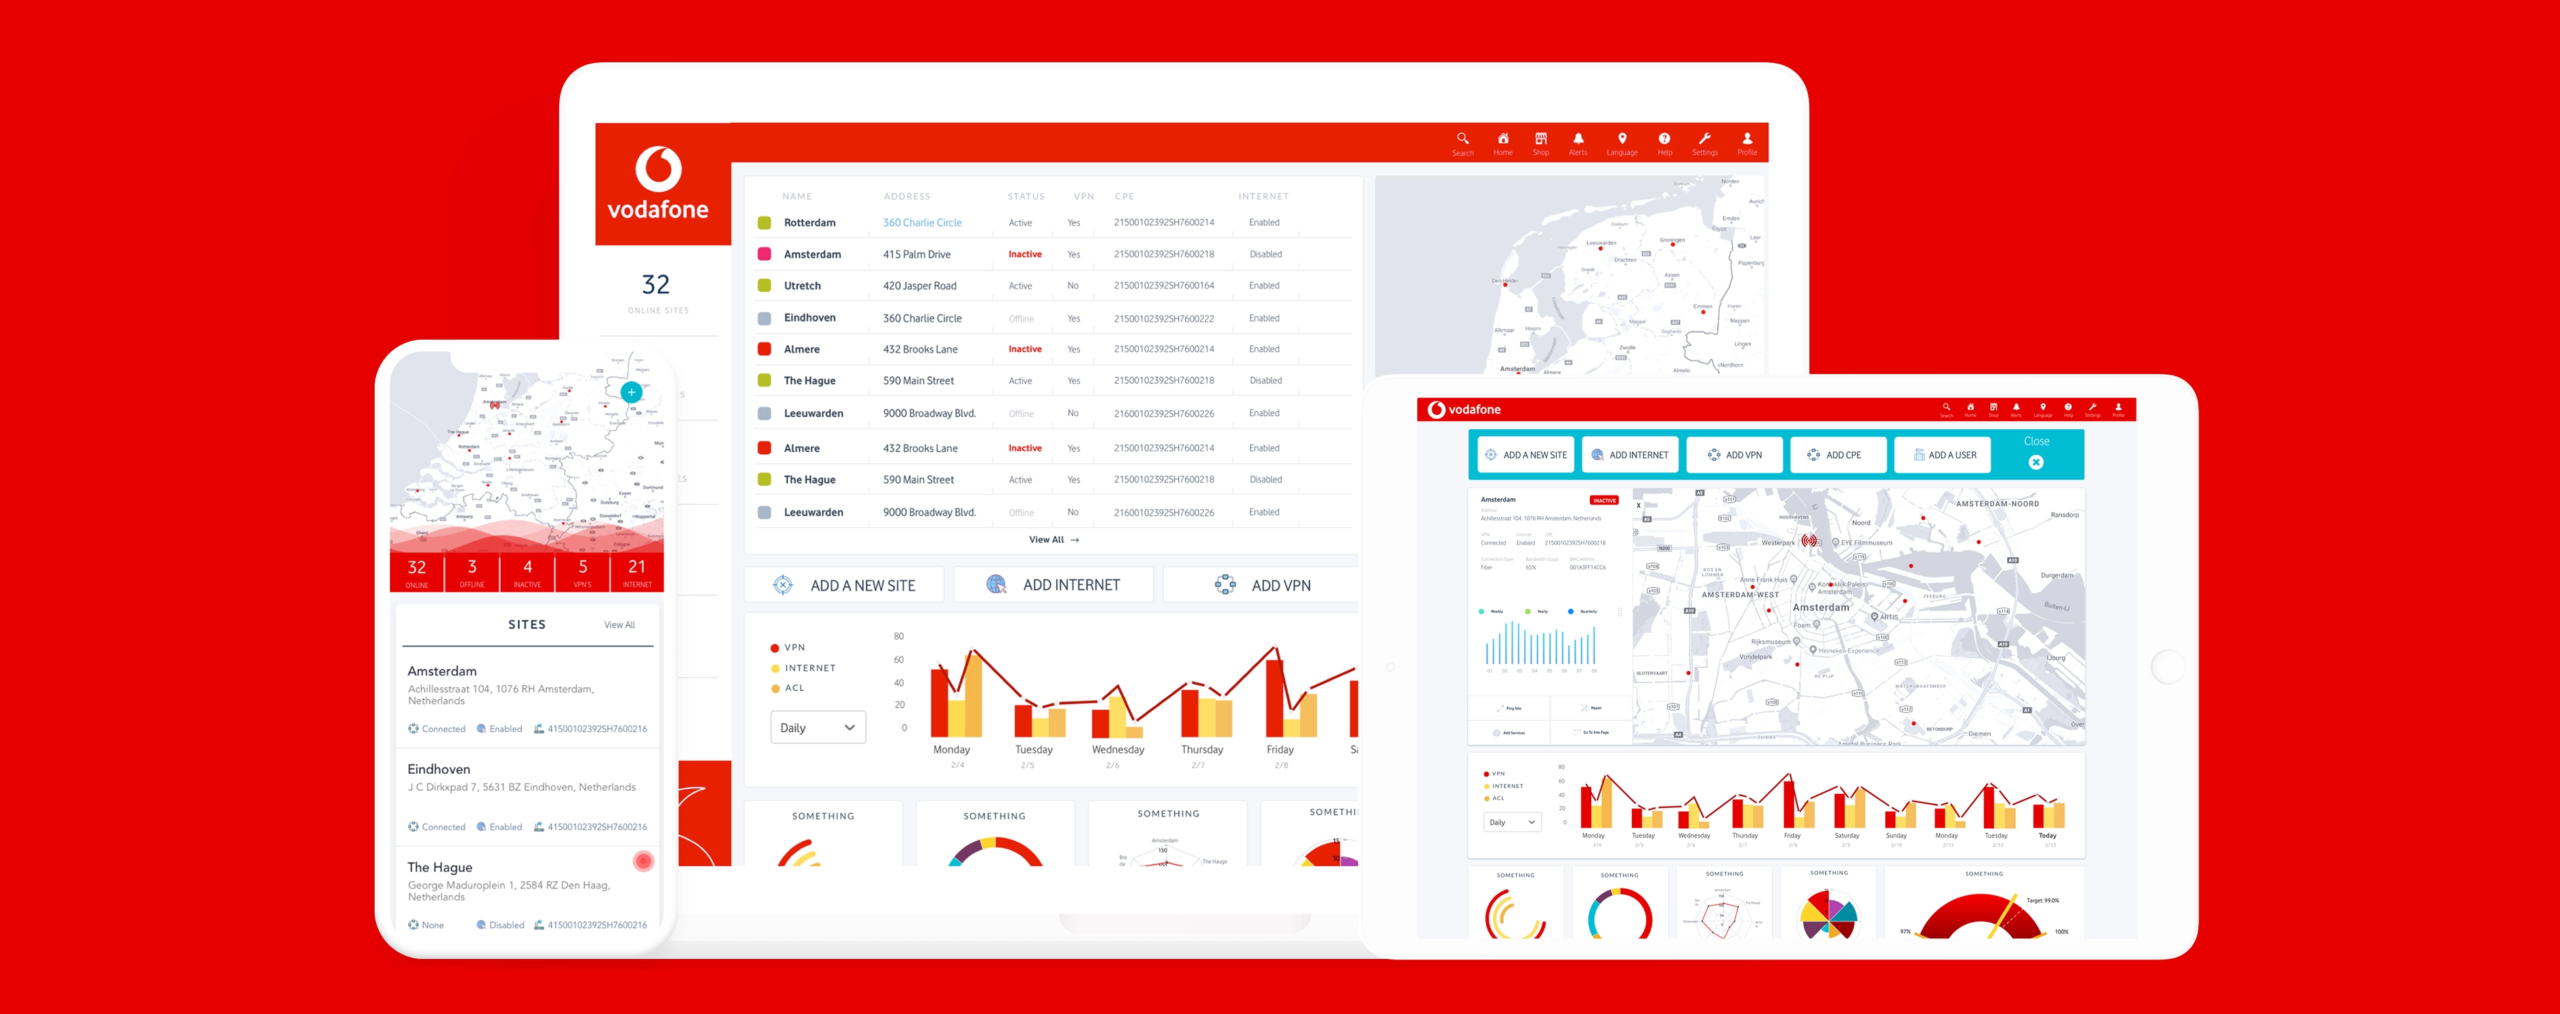
Vodafone needed a platform to make sense of massive volumes of operational and performance data across global teams, in real time. We designed a dashboard ecosystem that is as powerful as it is usable.
Challenges & Solutions
Layered data, shifting regional needs, and technical metrics in one product.
Operators needed to scan for exceptions without losing the detail required for investigation.
A configurable dashboard system for clear decisions at every scale.
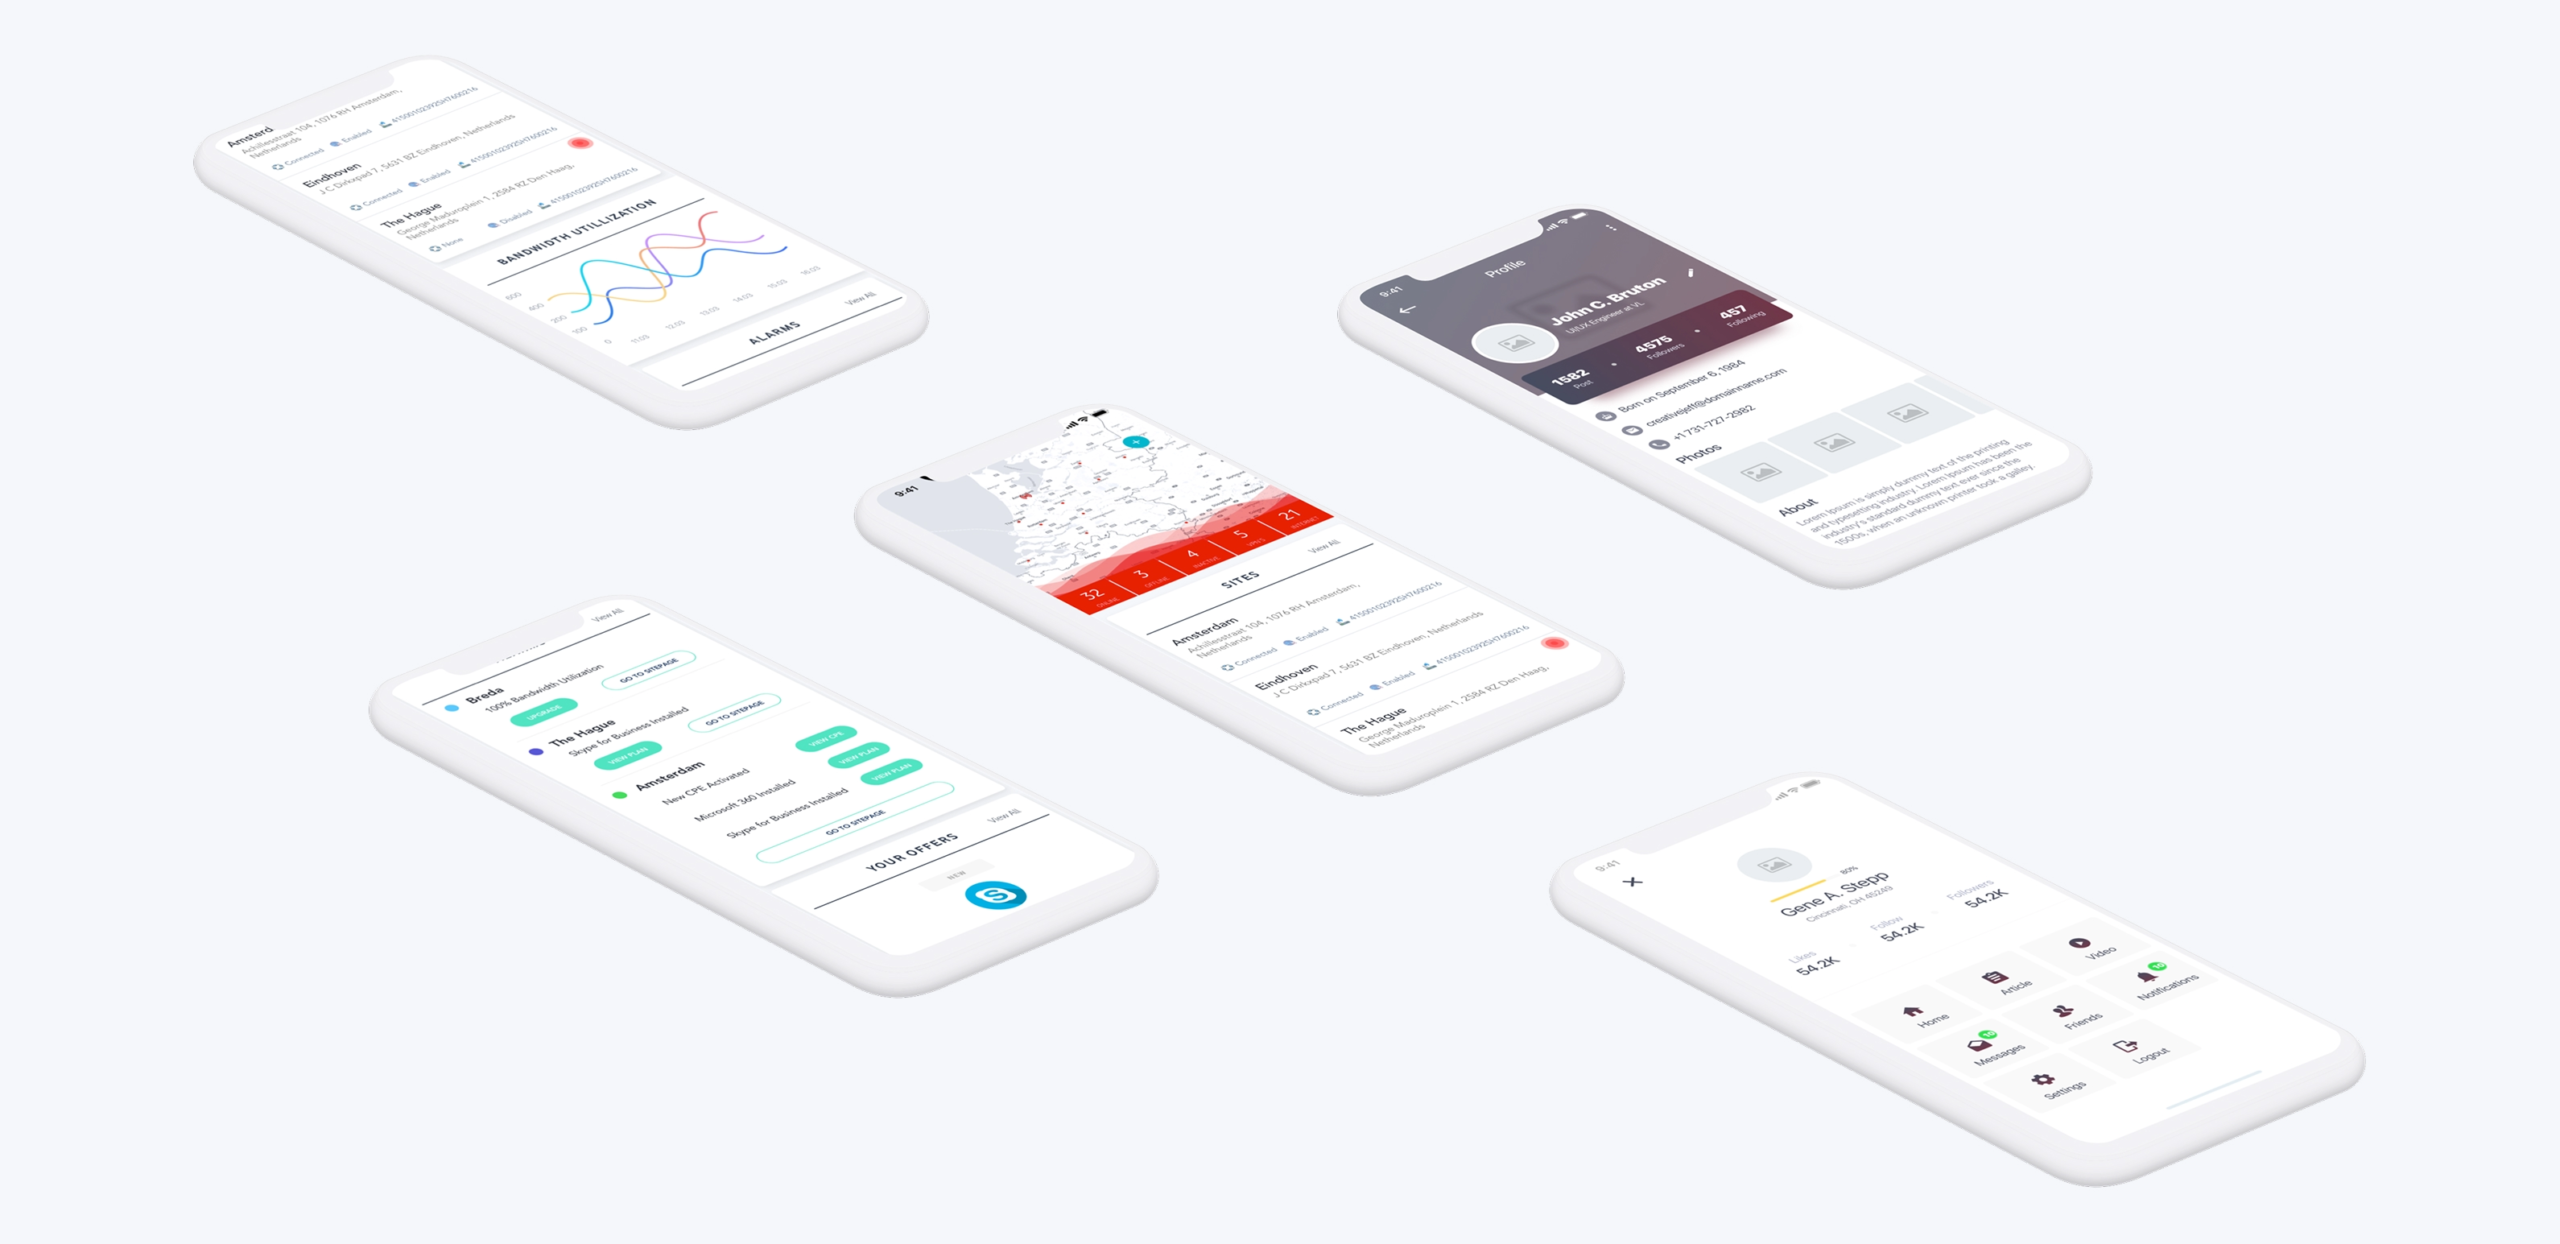
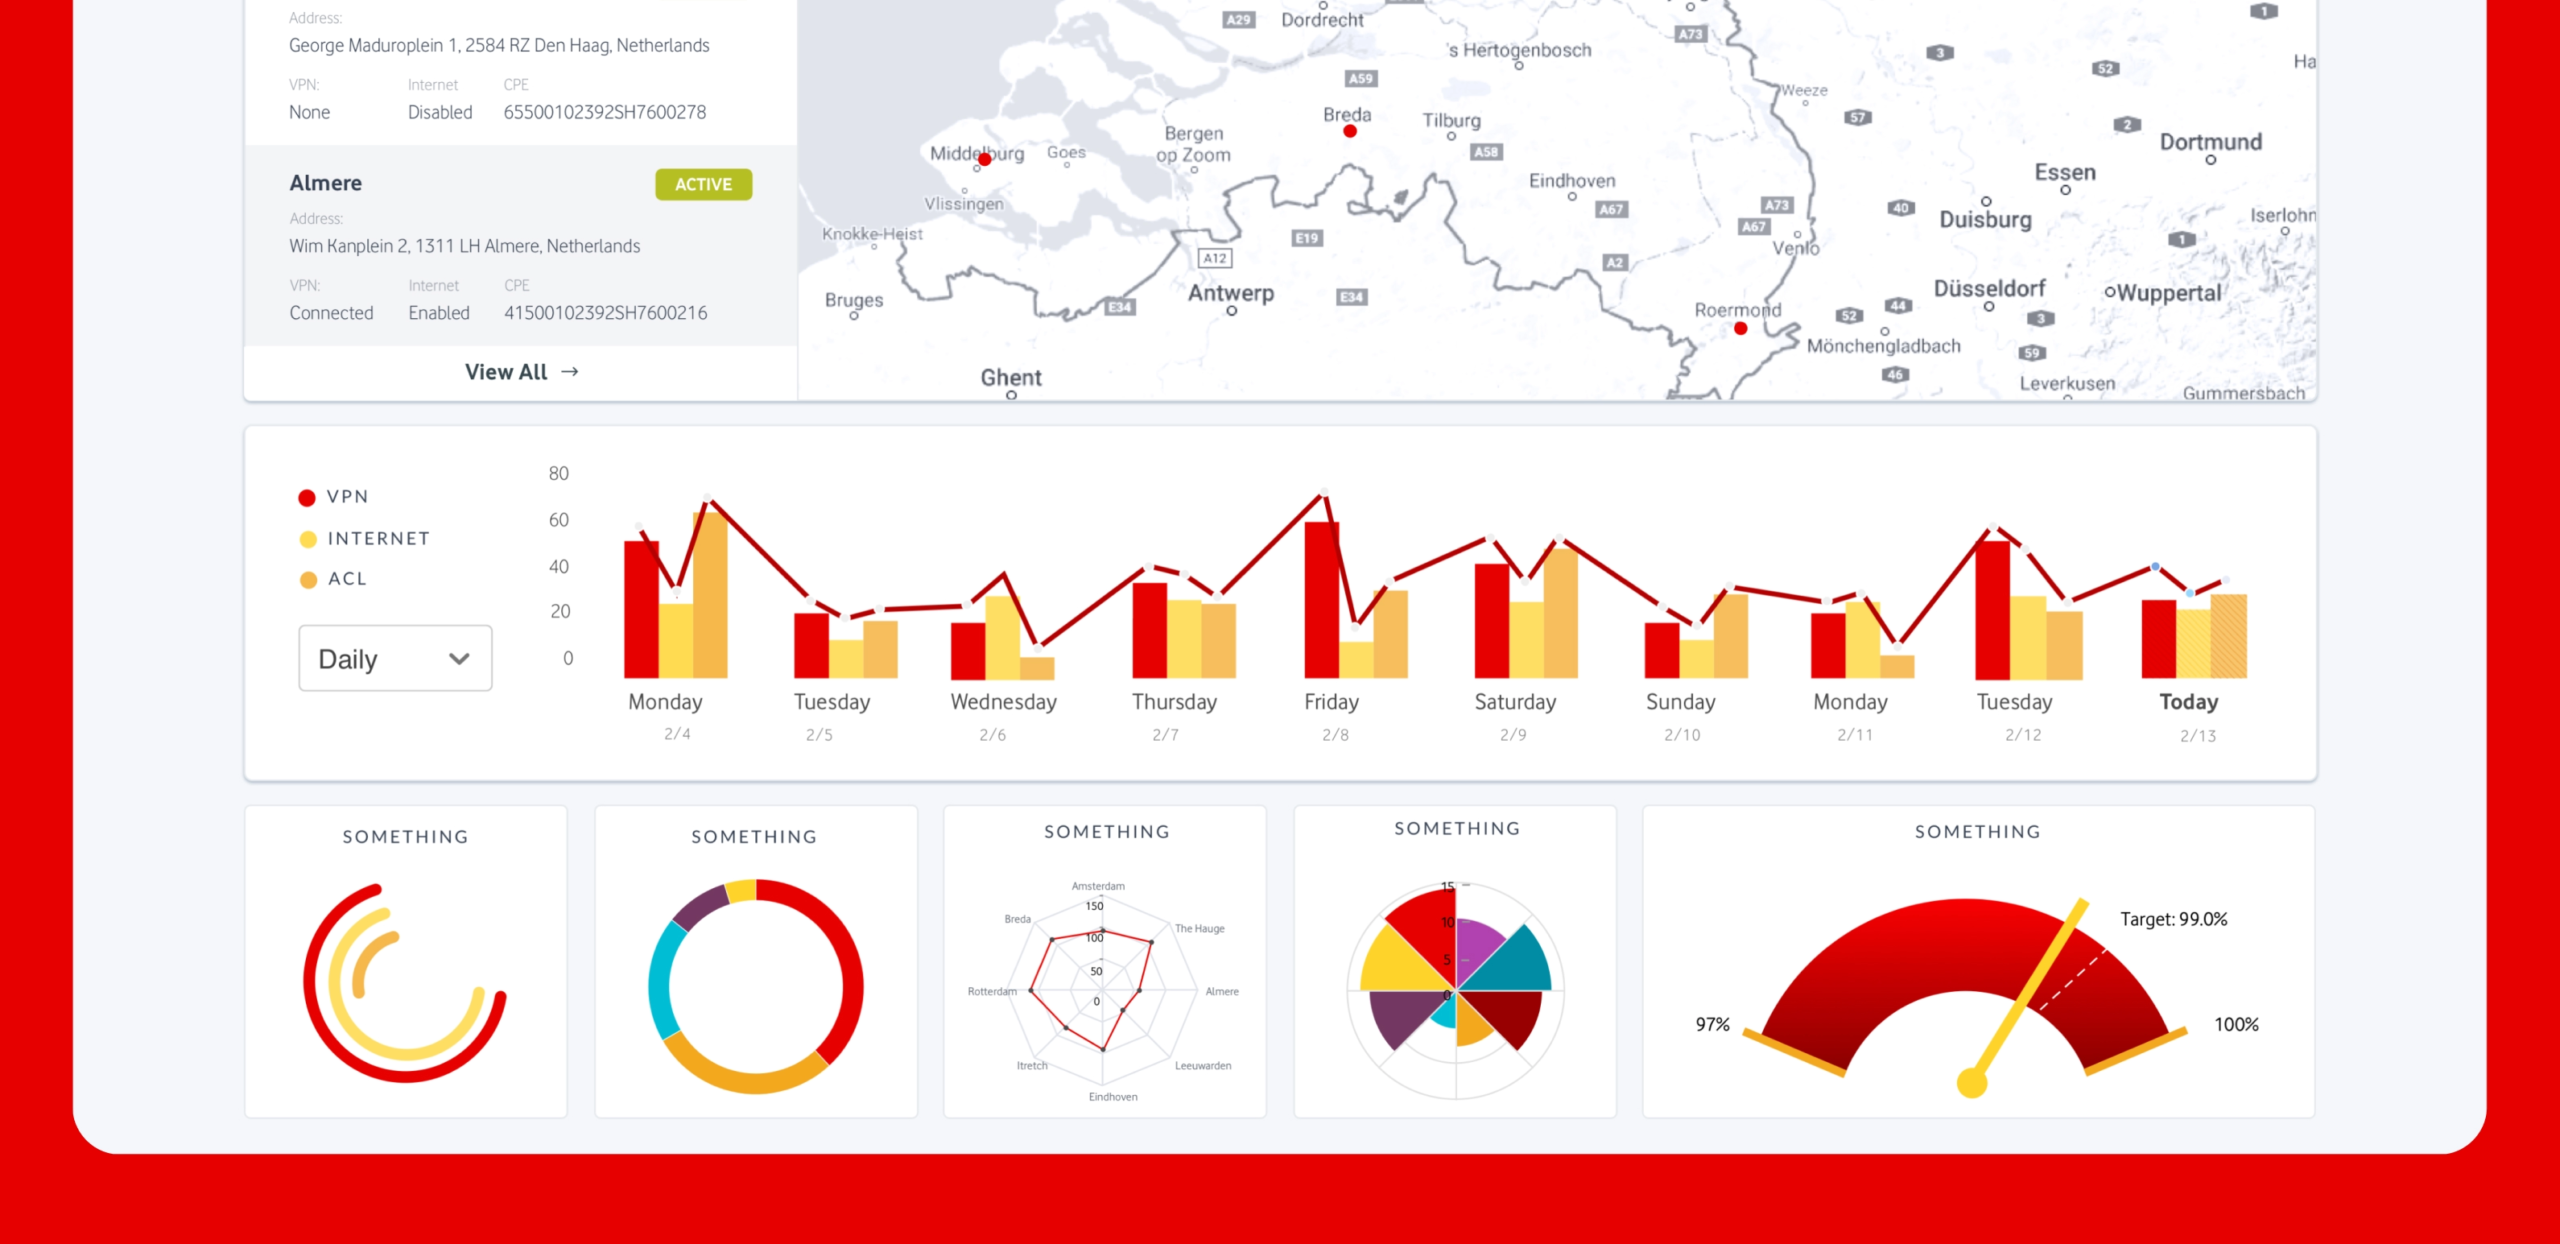
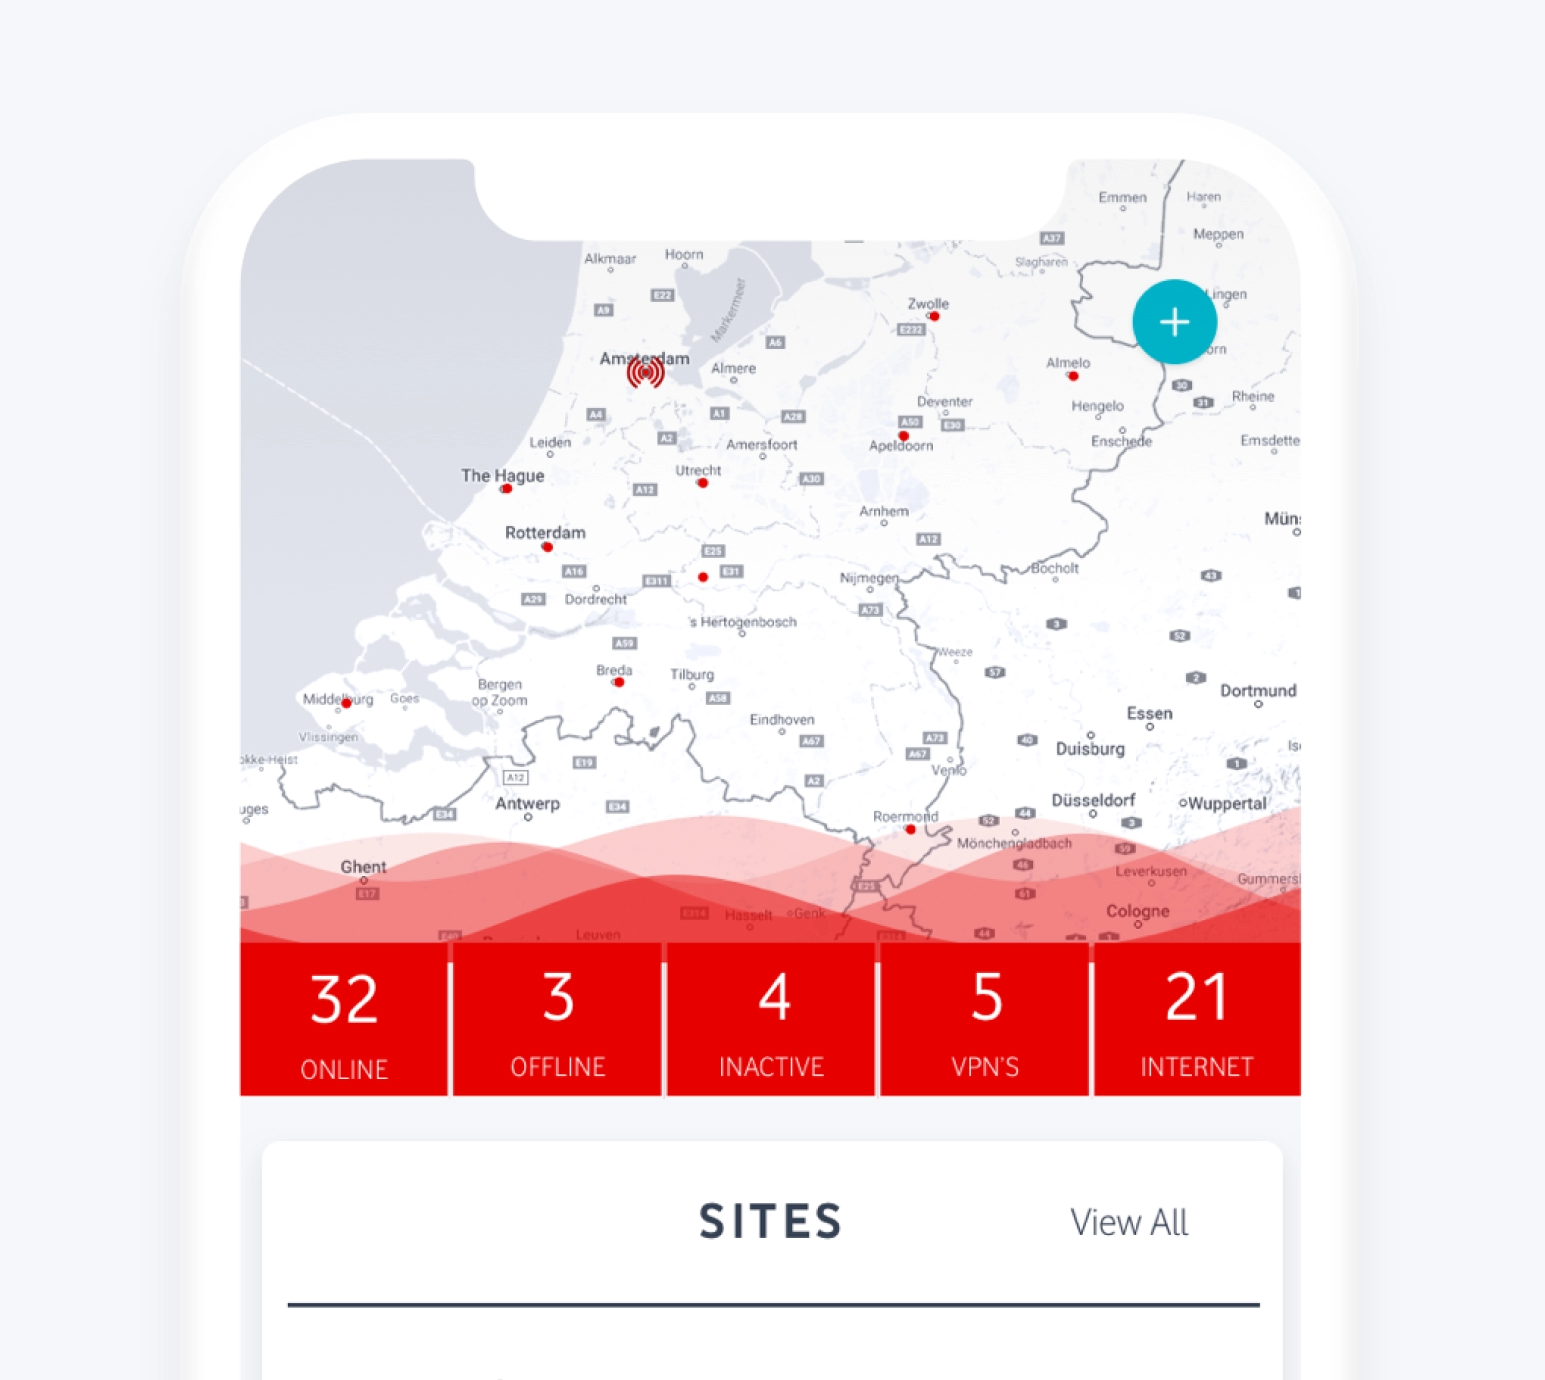
Maps, alerts, KPIs, and predictive charts surface what matters most first.
Built for the way teams read data.
We worked alongside Vodafone’s product and engineering teams to make complex operations easier to scan, explore, and act on.
Dashboard ecosystem
- Regional dashboard structure
- Role-based operational views
Data clarity
- Network maps
- Operational alerts
- KPI views
- Predictive charts
Responsive product
- Desktop experience
- Tablet layouts
- Mobile layouts
Making data work.
Clear visual hierarchy supports two reading modes: a quick scan to identify what changed and a deep drill-down to understand why. Teams can tailor the view by region, role, and need while shared patterns keep the system coherent.
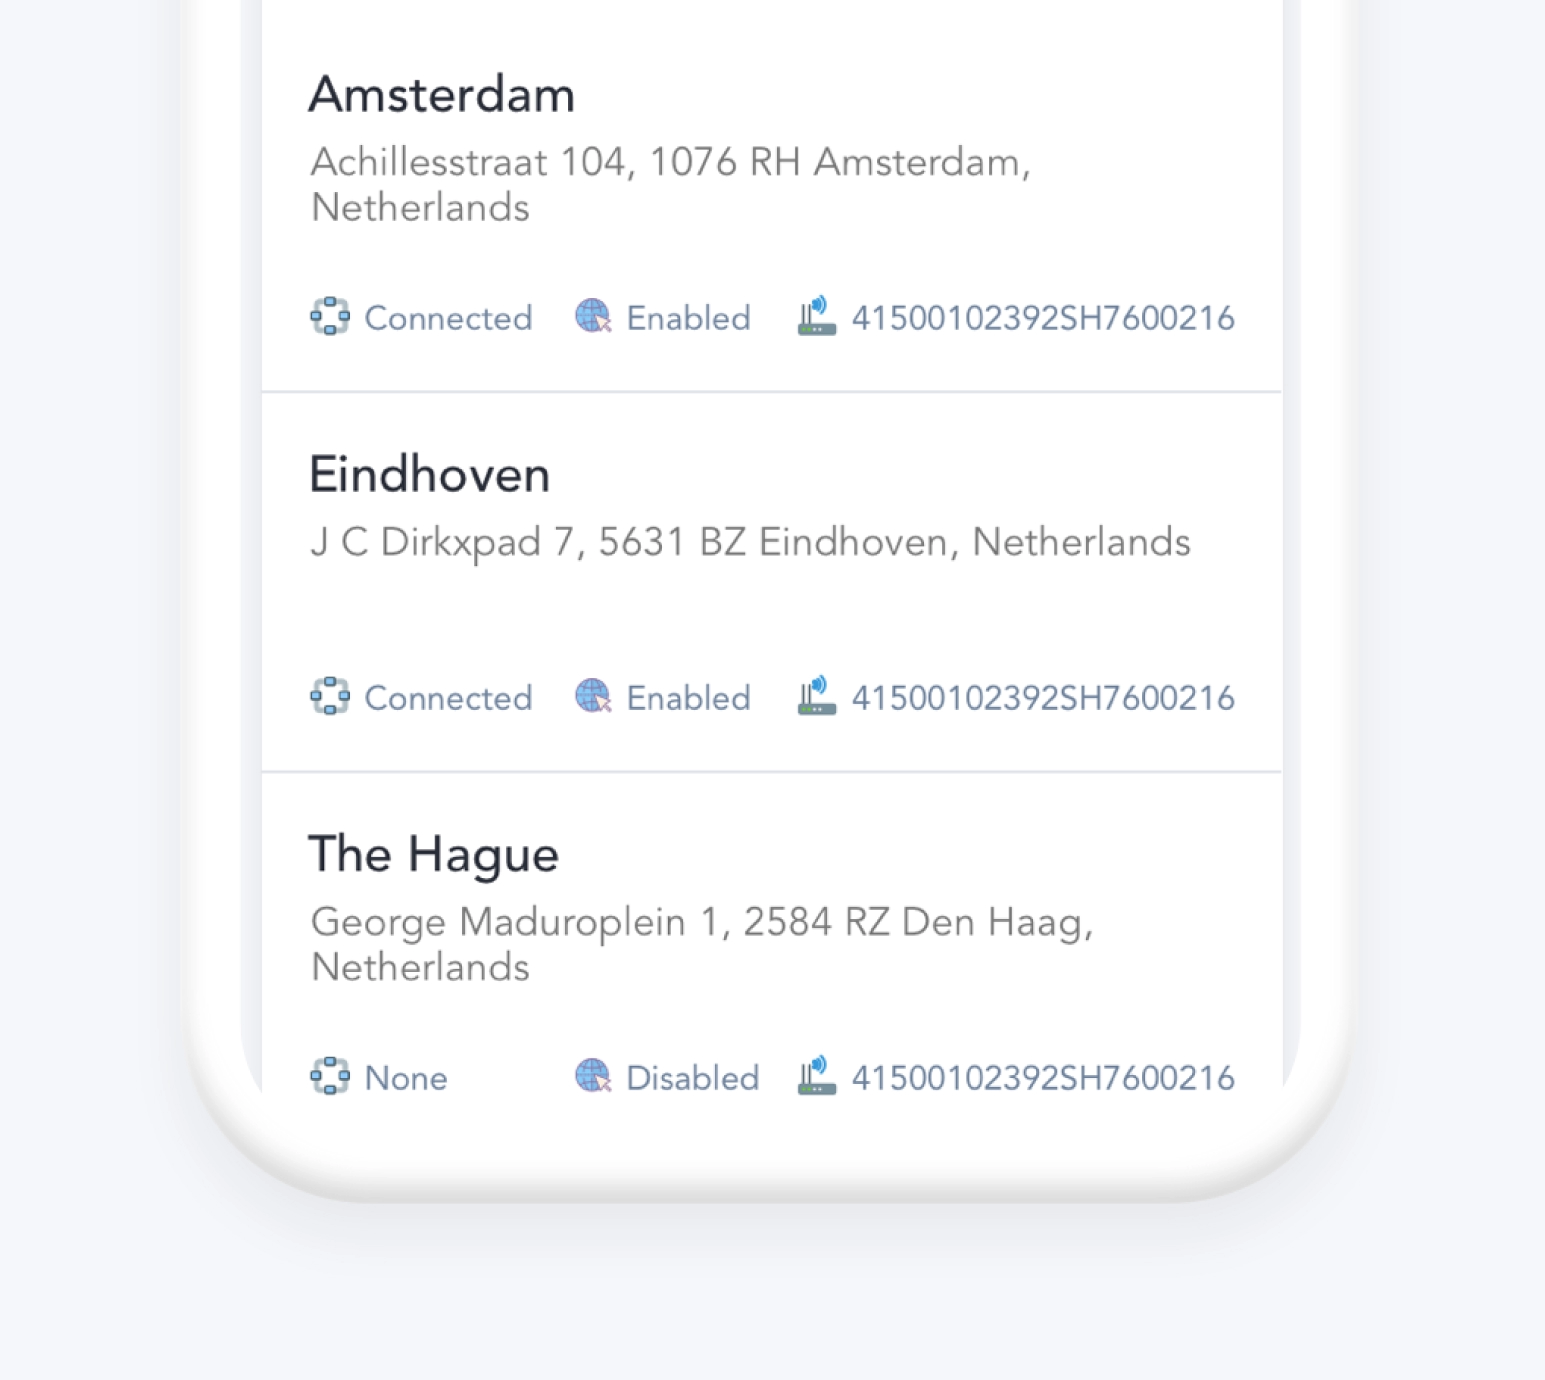
Clearer signals. Faster decisions.
The resulting product experience reduces onboarding friction and gives internal teams a confident way to spot issues sooner, explore them faster, and make better network decisions.
Ready to create?